
This article is provided for educational and informational purposes only. All compounds discussed are supplied strictly for laboratory and research use. Vitro Labs products are not for human or animal consumption.
The HPLC chromatogram printed on a Certificate of Analysis is the single most important quality signal in the research-grade compound supply chain. That squiggly line is how analytical labs put a number on the word purity. and how researchers verify that a vial labeled BPC-157 actually contains mostly BPC-157. Aguilar and colleagues published the foundational reversed-phase methodology in Methods in Molecular Biology in 2004 (PMID: 15064476), and two decades later the technique remains the workhorse of analytical characterization for research-grade materials.
This reference walks through what HPLC actually measures, how a compound chromatogram is generated and interpreted, what a purity percentage does and does not guarantee, and how to read a real Certificate of Analysis line by line. Every claim is tied to primary literature indexed in PubMed. The framing throughout is third-person, for laboratory research use only.
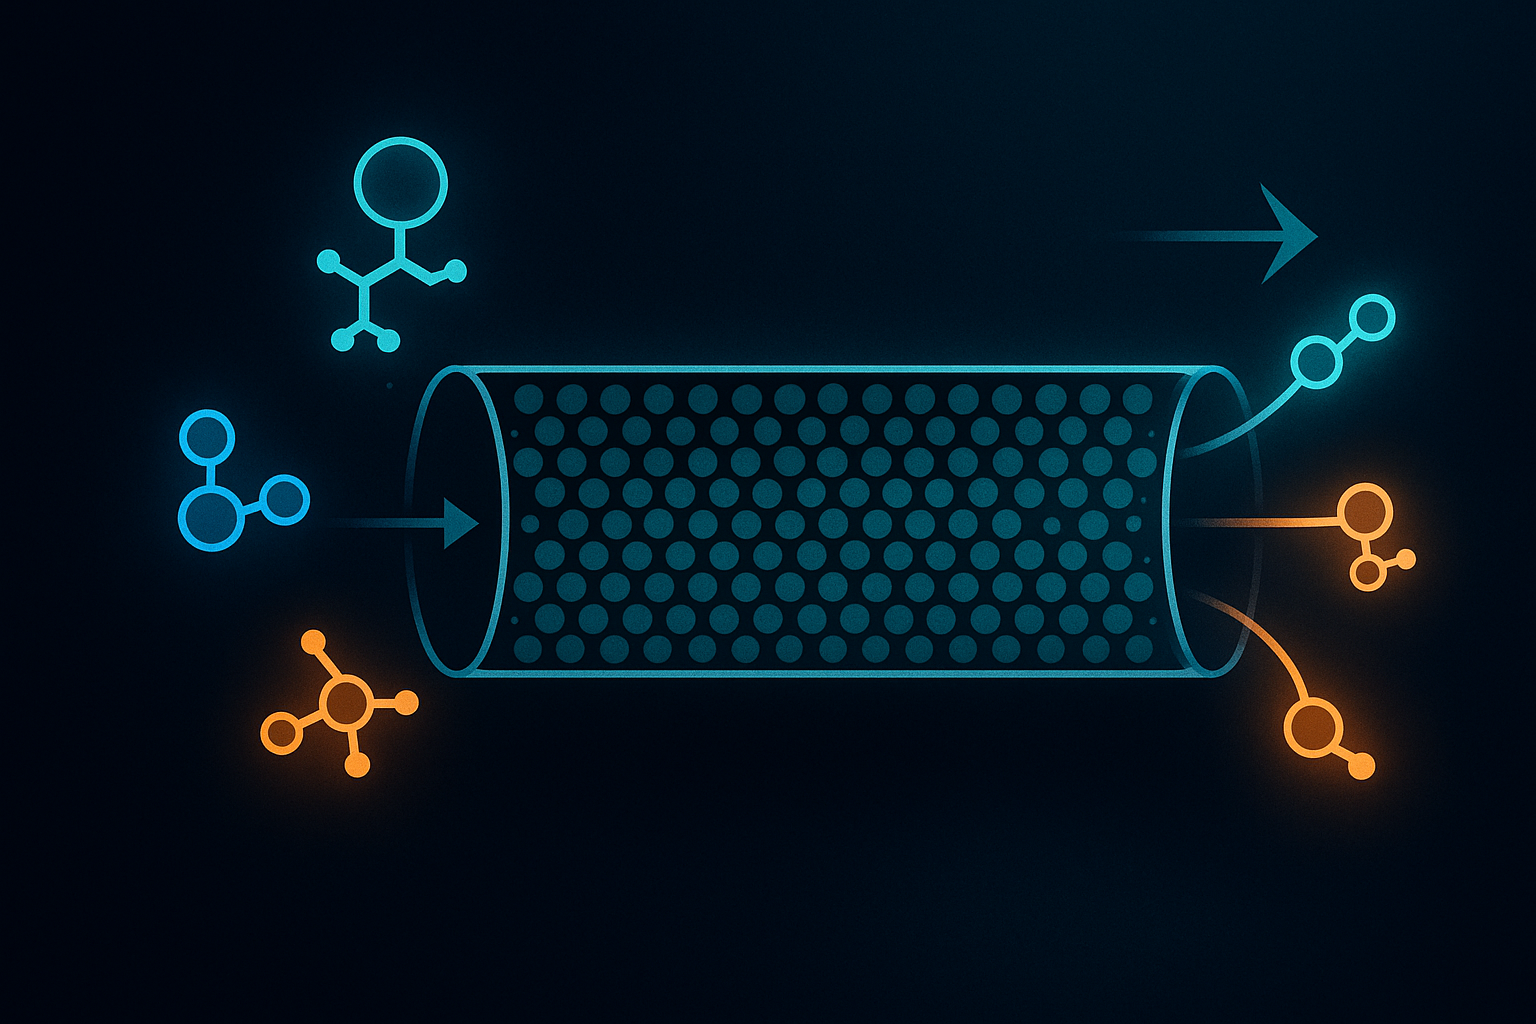
HPLC is a separation technique. That is worth stating plainly because the word purity tends to imply a direct measurement of contamination, and HPLC does not measure contamination directly. What HPLC does is take a dissolved sample, push it through a packed column under high pressure, and let the physical chemistry of the column separate the mixture into its component parts as they exit at different times.
A detector at the end of the column records each exit event as a peak. The area under each peak is proportional to how much of that component the detector saw.
Mant and Hodges laid out the theoretical basis for compound separation on reversed-phase columns in a foundational 1991 volume that is still cited in method development papers today (Mant & Hodges 1991, PMID: 1857425). Their central point: compounds separate on a hydrophobic stationary phase according to the sum of their side-chain hydrophobicities, modified by conformational effects and by whether the compound contains ionizable groups.
A well-tuned reversed-phase method can resolve compounds that differ by a single amino acid substitution, which is what makes the technique so useful for detecting synthesis-related impurities.
The purity value reported on a Certificate of Analysis is almost always a peak-area percentage. If the main peak accounts for 98.4% of the total UV absorbance measured across the chromatogram, the reported purity is 98.4%. This has two important implications.
First, the number depends on what the detector can see. A UV detector at 214 nm sees the amino-acid backbone strongly and sees most compound-related impurities strongly. It does not see residual salts, solvent, or moisture. those pass through invisibly. A compound that is 98.4% pure by HPLC-UV can still contain non-compound material that the method never registered.
Second, the number depends on the separation working. If two impurities co-elute with the main peak. that is, exit the column at the same time. they will be counted as part of the main peak and inflate the reported purity. Method validation exists specifically to prove that expected impurities are resolved from the target peak. A purity number attached to an unvalidated method is a weaker claim than a purity number attached to a validated one.
Reversed-phase is the geometry used for the vast majority of compound analytical work. The name is historical: chromatographers originally used polar stationary phases and non-polar mobile phases, and the reversed arrangement. non-polar stationary phase, polar mobile phase. was named in contrast. For compounds, the reversed geometry is a much better fit for the chemistry involved.
The column is a stainless-steel tube, typically 100 to 250 millimeters long and 2 to 4.6 millimeters in inner diameter, packed with silica microspheres coated in a hydrophobic ligand. The most common ligand is a straight-chain octadecyl group. eighteen carbons long. which gives the column its common name, C18.
Hancock and colleagues established the reversed-phase C18 approach for compounds in the early 1980s (Hancock, Bishop, Prestidge & Hearn 1978, PMID: 74440); their work is why nearly every compound COA references a C18 column today.
When a dissolved compound enters the column, its hydrophobic side chains interact with the C18 coating. Highly hydrophobic compounds stick harder. Highly hydrophilic compounds barely stick at all. To pull compounds off the column in a controlled way, the method uses a gradient. a mobile phase whose composition changes over time.
The mobile phase starts mostly aqueous. typically water with 0.1% trifluoroacetic acid to keep the compound protonated and improve peak shape. and increases in acetonitrile content over the course of the run. Acetonitrile competes with the compound for space on the C18 coating. As the acetonitrile fraction rises, compounds lose their grip and elute in order of increasing hydrophobicity.
The gradient shape matters. A shallow gradient gives better resolution but longer run times. A steep gradient runs faster but risks compressing peaks together. Method development for a specific compound is largely the process of tuning the gradient until every expected impurity resolves from the target peak.
After the compound leaves the column, it passes through a flow cell where a UV detector measures its absorbance. Compounds absorb strongly at 214 nm because the amide bond that links amino acids has a characteristic absorbance in that region. Some methods use 220 nm or 280 nm. 280 nm is selective for compounds containing tryptophan, tyrosine, or phenylalanine and gives a cleaner but less universal signal.
For research-grade purity work, 214 nm is standard because it detects nearly every compound impurity in addition to the target.
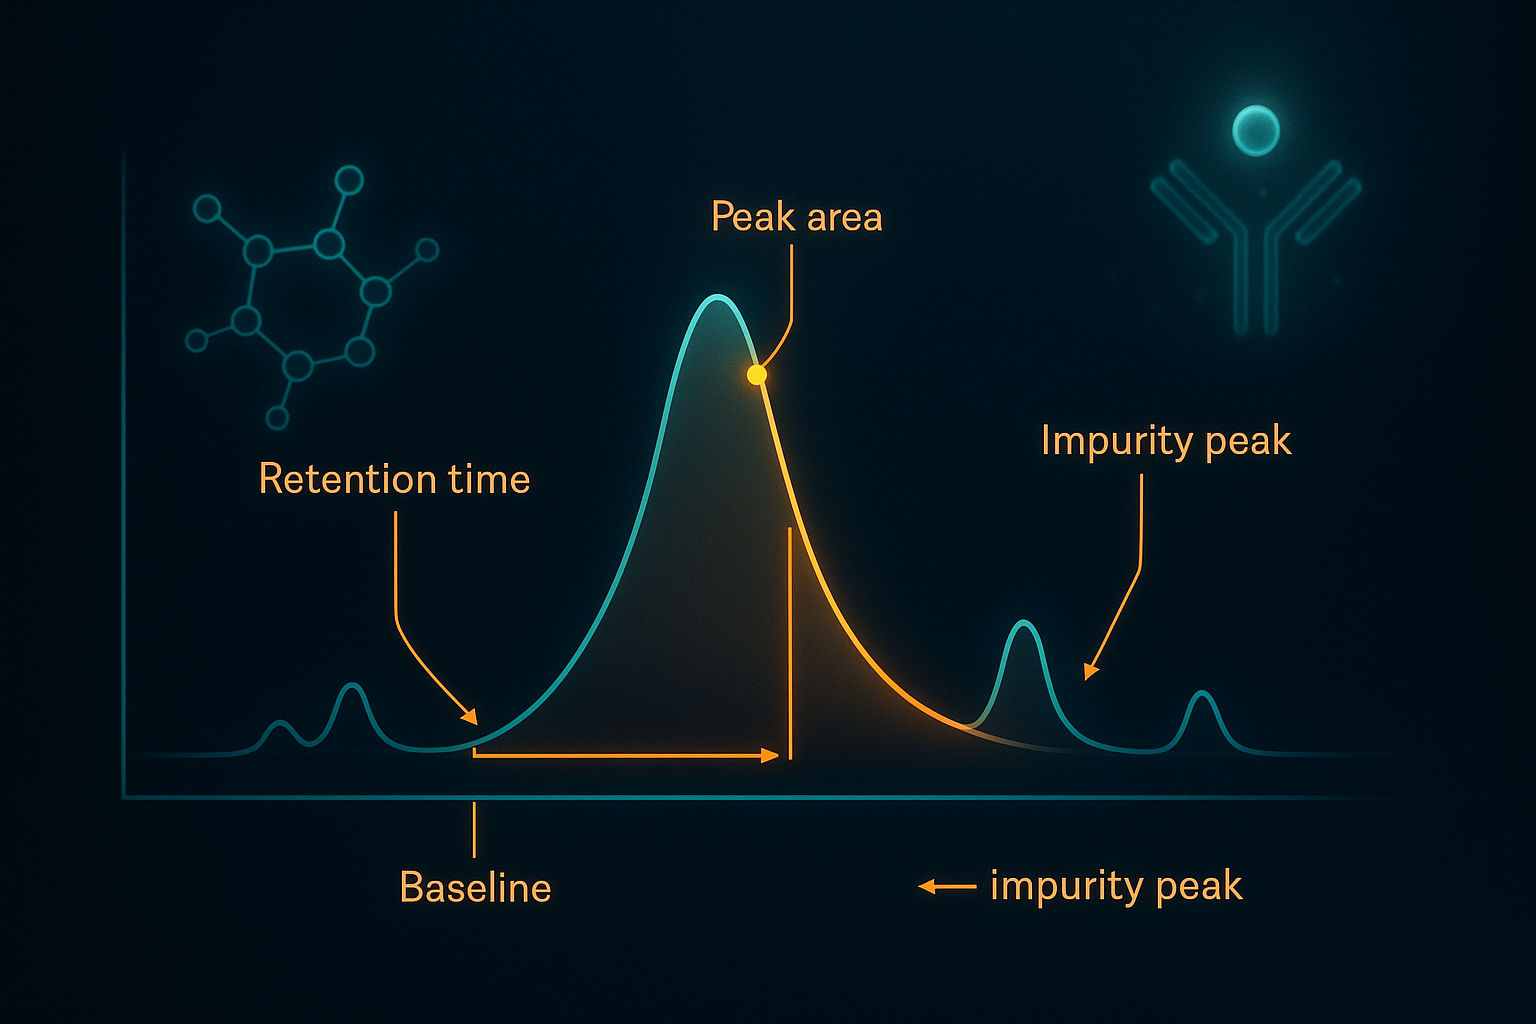
A chromatogram is a two-dimensional plot: time on the x-axis, detector signal on the y-axis. Every peak represents a component that eluted from the column at a specific retention time.
Retention time is the number of minutes between injection and peak apex. For a given column, gradient, and flow rate, retention time is reproducible within a fraction of a minute. that reproducibility is what lets an analytical lab confirm identity by co-elution. If a synthesized compound elutes at the same retention time as a validated reference standard under the same method, that is one line of identity evidence.
It is not sufficient on its own, but combined with mass-spectrometry identity confirmation, it becomes strong.
A well-behaved peak is roughly Gaussian. symmetric, with a defined apex and a smooth return to baseline. Poor peak shape signals a problem with the method or the sample. Tailing can indicate that the compound is interacting with residual silanol groups on the column surface. Fronting often means too much sample was injected. A peak that splits into two apices may indicate two conformers of the same compound co-eluting.
The baseline should be flat and low. A drifting baseline suggests the gradient is not equilibrating properly or the detector is contaminated. A noisy baseline makes small impurity peaks hard to distinguish from instrumental noise, which effectively raises the detection limit of the method.
The purity percentage is the area of the main peak divided by the sum of all peak areas in the chromatogram, multiplied by 100. If the main peak has an area of 9,840 units and the total peak area across the chromatogram is 10,000 units, the purity is 98.4%.
Three details make this calculation less mechanical than it looks.
The analyst has to define the time window over which peaks are counted. If the window is too narrow, late-eluting impurities are excluded and the purity is inflated. If it is too wide, injection artifacts and column bleed near the end of the run get counted as impurities and the purity is deflated. Method validation should specify the integration window.
Peak area is calculated relative to a baseline. If the baseline is drawn incorrectly. under a peak that has a shoulder, for example. the assigned area changes. Modern chromatography software automates this, but the analyst still has to confirm that the assignment is reasonable.
Different compounds absorb UV light with different intensities per unit mass. A truly rigorous purity calculation would correct each peak’s area for the response factor of the underlying compound. In practice, this correction is rarely applied because the response factors of impurities are usually unknown. The reported purity is therefore an uncorrected area percentage. a useful and reproducible number, but not a direct mass percentage.
Anyone reading a Certificate of Analysis should treat 98.4% as “98.4% of the UV signal at 214 nm,” not “98.4% by mass.”
“Peak area percentages provide a useful semiquantitative measure of purity, but the analyst must recognize that UV response varies with compound composition and that co-eluting impurities are counted as target material.”
, Aguilar (2004), reversed-phase compound separation methodology (PMID: 15064476)
The word HPLC covers two distinct activities, and Certificates of Analysis only report one of them.
Analytical HPLC is the version described so far in this article. Small sample injections. usually 5 to 50 microliters at low concentration. run through a narrow column and produce a chromatogram that characterizes the sample. Nothing is recovered from the column; the sample is consumed by the analysis. This is the technique that generates the purity number on a COA.
Preparative HPLC uses the same separation principle to purify material in bulk. Sample injections are much larger. grams rather than micrograms. and the column diameter scales up accordingly, sometimes to tens of centimeters. Fractions eluting from the column are physically collected and pooled based on where the target peak elutes. Preparative HPLC is a manufacturing step, not a characterization step.
When a Certificate of Analysis says “purified by reversed-phase HPLC,” it is referring to preparative HPLC as part of production. When the same COA reports a purity value, that value comes from a separate analytical HPLC run performed on the finished material. A researcher reading a COA should confirm that both were performed and that the analytical method used to verify purity is documented, not just referenced by name.
The small peaks that appear alongside the main peak in a compound chromatogram are not random noise. they are chemically defined molecules produced by the synthesis. Understanding what they are helps a researcher interpret a chromatogram beyond the single purity number.
Truncated and deletion sequences. Solid-phase synthesis builds a compound one amino acid at a time from the C-terminus. When a coupling step fails. the next amino acid does not attach to the growing chain. some fraction of the chains stall.
Depending on how the synthesis handles the failure, the result is either a truncated compound (the chain terminates early) or a deletion sequence (the missing residue is skipped and synthesis continues one amino acid short). Both are the most common impurity class in synthetic compounds and elute close to the main peak because they differ from it by only one or two residues.
Oxidation products. Methionine, cysteine, and tryptophan residues are all vulnerable to oxidation during synthesis or storage. An oxidized compound has slightly different hydrophobicity than the parent and elutes as a small peak just before or after the main peak.
Deamidation products. Asparagine and glutamine residues can convert to aspartic acid and glutamic acid over time, especially at neutral or basic pH. The resulting compound has one more negative charge than the parent and elutes at a different retention time.
Residual protecting groups. Compound synthesis uses temporary protecting groups on reactive side chains to prevent unwanted reactions. If a deprotection step is incomplete, the finished compound carries a residual protecting group and shows up as an impurity peak, usually eluting later than the main peak because most protecting groups are hydrophobic.
Solvent residues. Trifluoroacetic acid from the deprotection and cleavage steps, or acetonitrile from the mobile phase, can remain in the finished material. These do not usually appear as UV peaks. they are the invisible fraction referenced in the purity-is-a-ratio discussion above. Residual solvent testing requires separate methods, typically gas chromatography.
The detector at the end of the column determines what the chromatogram can see.
UV at 214 nm is the standard because the amide bond absorbs there. UV at 280 nm is more selective for aromatic residues and can be used as a confirmatory wavelength. Some methods report dual-wavelength chromatograms to give the reader more information.
ELSD detects any non-volatile material eluting from the column regardless of whether it absorbs UV light. It is useful for detecting impurities that UV would miss, but it is less sensitive than UV for typical compound work and is not commonly used on research-grade Certificates of Analysis.
Coupling HPLC to a mass spectrometer. usually via electrospray ionization. produces two complementary streams of data. The HPLC provides the separation and the purity number. The mass spectrometer provides the molecular mass of the component under each peak, which confirms identity. Loo and colleagues established the analytical framework for electrospray ionization mass spectrometry of compounds in the early 1990s (Loo, Edmonds & Smith 1991, PMID: 1892748).
A modern research-grade Certificate of Analysis should include both HPLC purity and mass-spectrometry identity confirmation. A COA that shows only HPLC purity is proving that something was 98% pure, without proving that the something was the target compound.
The same batch of the same compound can be reported at 98.7% purity by one lab and 97.9% by another. The disagreement is not usually a lab error. it is a consequence of different validated methods.
A validated method has been shown to resolve the target peak from expected impurities. Two labs may use gradients with different slopes, columns from different manufacturers, or run temperatures that differ by a few degrees. Each choice slightly changes how impurities separate from the main peak, which slightly changes the reported purity.
Method validation includes proving that the detector response is linear across the concentration range used in the assay. If linearity breaks down at high or low concentration, small impurities near the detection limit may be under- or over-counted.
A well-validated method includes repeatability data. multiple injections of the same sample by the same analyst produce purity values within a defined range, and multiple analysts using the same method also produce values within a defined range. A COA that reports 98.4% purity is more meaningful when the underlying method has documented repeatability of ±0.3%.
⚗️ Research Disclaimer: All content on this page is intended exclusively for licensed researchers, academic institutions, and scientific professionals operating within approved laboratory settings. The compounds and analytical methods discussed here relate to laboratory characterization of research-grade materials not approved for human clinical use by the FDA or equivalent regulatory authorities. This content does not constitute medical advice, clinical guidance, or a recommendation for use in humans or animals outside of approved research protocols.
A well-constructed Certificate of Analysis has a predictable anatomy.
Reading it top to bottom, a researcher should find several elements woven into a single document. Sample identity and batch number appear at the top. the exact compound name, the sequence written in one-letter or three-letter code, and a batch or lot identifier that ties the certificate to a specific production run. Method reference follows: the analytical method used, cited by name or number, ideally with enough detail to trace which validated procedure was applied. Column and conditions should be spelled out. column dimensions and packing chemistry (e.g., C18, 4.6 x 150 mm, 5 μm), mobile phase composition, gradient profile, flow rate, detection wavelength, injection volume, and column temperature.
Without these details, the purity number cannot be independently reproduced or challenged.
Next comes the chromatogram image: the actual plot with time on the x-axis and detector response on the y-axis, showing the main peak and any impurities. A chromatogram-less COA is a weaker document. The peak table lists each integrated peak. retention time, area, and area percentage. so the reader can see how the software divided the signal.
The purity value is the summary number, and reading it correctly means treating it as “main peak area as a percentage of total integrated area under the specified method,” not as a mass percentage. Finally, the retention time of the main peak is documented for future reference; a subsequent batch of the same compound analyzed under the same method should elute at the same retention time within a small tolerance.
A rigorous COA pairs the HPLC section with a mass-spectrometry section. The mass-spec panel shows the observed molecular ion mass, compares it to the theoretical mass calculated from the sequence, and reports the difference. Small differences (fractions of a Dalton) are normal. Large differences indicate a synthesis or identity problem.
HPLC-UV purity is a strong quality signal but a narrow one. It answers a specific question: what fraction of the UV-absorbing material eluting from the column under this method is the target compound. It does not answer several other questions that matter for research-grade material.
Identity. HPLC purity alone cannot confirm that the target compound is what the label says. A methionine-substituted analog of the correct compound could elute at nearly the same retention time and produce a chromatogram that looks identical. Only mass spectrometry. ideally coupled to the HPLC or run as a separate analysis. can confirm identity by molecular mass.
Net compound content. The dry material in the vial is not 100% compound. It contains counter-ions (typically trifluoroacetate from the synthesis), residual water, and residual salts. A rigorous COA reports net compound content separately, usually determined by amino acid analysis or nitrogen combustion.
Sterility, endotoxin, heavy metals, and residual solvents. None of these are visible to HPLC-UV. Each requires its own dedicated assay. Most Certificates of Analysis for research-grade materials do not include these tests, and a COA that is silent on sterility or endotoxin is not claiming the material is sterile or pyrogen-free. it is simply not testing for it. Researchers working with materials in any application should independently confirm what a given COA does and does not certify.
Distilling the above into an operational checklist gives a researcher evaluating a Certificate of Analysis a way to assess how much information the document actually contains.
Vitro Labs’ Certificates of Analysis are issued by Freedom Diagnostics, an independent ISO-certified analytical laboratory in Franklin, Tennessee, and are batch-specific. Researchers can review a sample certificate on the Certificates of Analysis page before adding a specific batch to laboratory inventory. The Editorial Standards page documents the sourcing and citation discipline applied across the Research Library.
It means that under the specific analytical method used, 98% of the ultraviolet-absorbing material eluting from the column at 214 nm was the target compound, calculated as peak area percentage. It does not mean the vial contents are 98% compound by mass. the dry material also contains counter-ions, residual moisture, and possibly residual salts. A separate net compound content assay is required for the mass percentage. Aguilar (2004) established the standard methodology (PMID: 15064476).
Different analytical labs use different validated methods. column dimensions, gradient slopes, column temperatures, and flow rates all vary. Each parameter slightly changes how impurities separate from the main peak, which slightly changes the reported purity percentage. A difference of a few tenths of a percent between two labs is usually a method-difference artifact, not a material difference. The reported purity is only fully interpretable when read alongside the method parameters.
Preparative HPLC is a production step. it separates and purifies material in bulk, with fractions physically collected and pooled. Analytical HPLC is a characterization step. a small aliquot is injected, separated, and detected to produce the purity number that appears on the COA. A well-documented COA distinguishes the two: the compound was purified by preparative HPLC during manufacture, and the resulting material was then characterized by a separate analytical HPLC run whose method parameters are documented on the certificate.
No. HPLC purity confirms that most of the UV signal came from a single component, but it cannot confirm the identity of that component. A related compound with a single amino acid substitution can elute at nearly the same retention time and produce a nearly identical chromatogram. Identity confirmation requires mass spectrometry, where the observed molecular mass is compared to the theoretical mass calculated from the intended sequence. Loo and colleagues established the electrospray methodology commonly used (PMID: 1892748). A rigorous research-grade COA includes both HPLC purity and MS identity confirmation.
HPLC-UV at 214 nm detects most compound-related impurities. truncated sequences, oxidation products, deamidation products, and residual protecting groups. because they all contain UV-absorbing amide bonds. It does not detect residual salts, residual solvents (trifluoroacetic acid, acetonitrile), moisture, endotoxin, heavy metals, or microbial contamination. Each of those requires a separate assay. A purity number is a strong quality signal within its scope but a narrow one; the full quality picture of a research-grade material requires additional characterization beyond a single HPLC chromatogram.
The amide bond that links amino acids in a compound has a strong absorbance around 210 to 220 nm. Detecting at 214 nm therefore sees essentially every compound component regardless of whether it contains aromatic amino acids. Detection at 280 nm is more selective. it only sees compounds containing tryptophan, tyrosine, or phenylalanine. and gives a cleaner but less universal signal. For purity work where the goal is to detect every possible compound impurity, 214 nm is the standard because it maximizes what the detector can see.
⚗️ Research Disclaimer: All content on this page is intended exclusively for licensed researchers, academic institutions, and scientific professionals operating within approved laboratory settings. The compounds and analytical methods discussed here relate to laboratory characterization of research-grade materials not approved for human clinical use by the FDA or equivalent regulatory authorities. This content does not constitute medical advice, clinical guidance, or a recommendation for use in humans or animals outside of approved research protocols.