
This article is provided for educational and informational purposes only. All compounds discussed are supplied strictly for laboratory and research use. Vitro Labs products are not for human or animal consumption.
Open a Certificate of Analysis for a research-grade compound and you will usually find two headline documents attached: an HPLC chromatogram and a mass spectrometry (MS) report. The chromatogram tells you how pure the sample is. The mass spectrometry report tells you whether the molecule in the vial is actually the compound on the label.
These are two different questions, and researchers who conflate them get burned. A sample can be 99% pure and still be the wrong molecule. Mass spectrometry is the check that catches that. It measures the mass of the compound to within a fraction of a Dalton, and compares it to the theoretical mass calculated from the amino acid sequence.
This article walks through how to read the MS report on a research-grade compound. for laboratory research use only. What the numbers mean, what a healthy report looks like, and what patterns should send a researcher back to the vendor with questions.
Mass spectrometry is, at its core, a very precise scale for molecules. A sample is ionized (given an electrical charge), pushed through a magnetic or electric field, and separated by its mass-to-charge ratio (m/z). Ions of different mass hit the detector at different times or in different positions, and the instrument reports the intensity of each.
For a compound, this matters because the amino acid sequence dictates the exact mass of the molecule. Add up the masses of the individual amino acid residues, subtract a water molecule for each amide bond formed, and you have the theoretical mass of the compound. If the instrument measures a mass that matches, the molecule is (probably) what the label says. If it does not, something is wrong. a wrong sequence, a modification, a degradation product, or a contaminant.
The technique dates to the early 20th century, but its usefulness for compounds took off after the invention of soft ionization methods in the 1980s. John Fenn’s electrospray ionization work, which won the Nobel Prize in Chemistry in 2002, made it possible to weigh intact compounds and proteins without shattering them (Fenn et al., 1989, PMID: 2675315). Before ESI, large biological molecules broke apart the moment you tried to ionize them.
Two ionization methods dominate compound MS reports: electrospray ionization (ESI) and matrix-assisted laser desorption/ionization (MALDI). A researcher reading a report should know which was used, because the spectrum looks different.
In ESI, the compound is dissolved in solvent and sprayed through a charged needle. The solvent evaporates and leaves gas-phase ions behind. The key feature: ESI tends to produce multiply-charged ions. A single compound molecule might pick up 2, 3, 4, or more protons, and each charge state shows up as a separate peak. The spectrum can look busy at first glance.
In MALDI, the compound is co-crystallized with a light-absorbing matrix and hit with a laser. The matrix absorbs the energy and vaporizes the compound with it. MALDI tends to produce singly-charged ions, which makes the spectrum simpler to read. Karas and Hillenkamp introduced the technique in 1988 and it became the workhorse for early compound identification (Karas & Hillenkamp, 1988, PMID: 3239801).
Most modern compound CoAs use ESI coupled to a time-of-flight or Orbitrap analyzer, because it plays well with the liquid chromatography stage that usually precedes it. If the report says LC-MS, ESI is the safe assumption.
A typical MS report on a Certificate of Analysis contains a small number of elements. Once a researcher knows the layout, reading it becomes routine.
| Element | What It Tells You |
|---|---|
| Sample identifier and lot number | Links the spectrum to a specific batch. Verify this matches the lot on the vial. |
| Method statement | Instrument, ionization mode, calibration standard, scan range. |
| Theoretical mass | Calculated from the amino-acid sequence. Usually reported as monoisotopic and average mass. |
| Observed mass | What the instrument measured after deconvolution. |
| Mass spectrum plot | m/z on the x-axis, intensity on the y-axis. Shows the ion peaks. |
| Pass/fail statement | Analyst’s conclusion that observed mass matches theoretical within tolerance. |
A well-formed research CoA. the kind Freedom Diagnostics issues on Vitro Labs lots. puts these elements in one place with the analyst’s initials and a calibration date. Analytical-grade biochemical reference standards depend on this documentation being reproducible: another lab, given the same sample, should be able to run the method and get the same numbers.
The single most important feature of any compound mass spectrum is the molecular ion peak. This is the peak that corresponds to the intact compound plus whatever protons it picked up during ionization.
On a spectrum from an ESI instrument, the molecular ion may not be the tallest peak. It may show up as a series of peaks representing different charge states: [M+H]+, [M+2H]2+, [M+3H]3+, and so on. Each of these corresponds to the same molecule carrying a different number of protons. The analyst deconvolutes these into a single reported mass, which is what shows up on the CoA as the observed mass.
For a MALDI spectrum, the molecular ion is usually the largest single peak in the spectrum and appears at m/z equal to the compound mass plus one (for the single proton). If a researcher can find one peak that matches the theoretical mass within about a Dalton, the identity call is straightforward.
This is where ESI reports confuse people. Say a compound has a theoretical mass of 4813.5 Da (the mass of Tirzepatide, roughly). An ESI spectrum will not show a peak at 4813.5. It will show peaks at:
Each of those peaks represents the same molecule; they just carry different numbers of protons. The instrument software takes the raw spectrum and deconvolutes the charge states into one reconstructed mass. If the report shows a deconvoluted mass of 4813.4 and the theoretical is 4813.5, the identity is confirmed.
Researchers new to ESI spectra sometimes look at the raw m/z axis and panic because the numbers do not match the compound mass on the label. The numbers are not supposed to match the raw axis. they are supposed to match the deconvoluted output.
Modern high-resolution mass spectrometers do more than measure the average mass. They resolve individual isotope peaks. Every compound, because it contains carbon, has a small percentage of 13C atoms mixed in with the dominant 12C. This gives the compound an isotope envelope. a cluster of peaks separated by roughly 1 Dalton.
The spacing between isotope peaks tells the researcher the charge state directly. Peaks separated by 1.0 m/z indicate a singly-charged ion. Peaks separated by 0.5 m/z indicate a doubly-charged ion. Peaks separated by 0.33 m/z indicate a triply-charged ion. The pattern of relative intensities within the envelope (the ratio of the monoisotopic peak to the +1 peak, the +2 peak, and so on) matches a predictable distribution based on the number of carbons in the molecule.
The theoretical mass on a CoA is not arbitrary. It is calculated from the amino acid sequence using standard residue masses. Any researcher can do this calculation independently as a check on the CoA.
Free tools like the ExPASy Compute pI/Mw utility and the CompoundMass calculator (both from SIB Swiss Institute of Bioinformatics) do this instantly and are the standard second-source check when a CoA looks off.
How close does the observed mass need to be to the theoretical mass? The answer depends on the instrument.
| Instrument Type | Typical Mass Accuracy | Reasonable Tolerance |
|---|---|---|
| Quadrupole (low-res) | ~100 ppm | ±0.5–1.0 Da |
| Time-of-Flight (TOF) | ~5–20 ppm | ±0.05–0.2 Da |
| Orbitrap / FT-ICR | ~1–5 ppm | ±0.01–0.05 Da |
ppm is the standard unit here because it scales with the molecule’s mass. A 10 ppm error on a small compound is a fraction of a Dalton; on a large one it can be half a Dalton. Most research-grade compound CoAs use TOF or Orbitrap analyzers and quote observed masses accurate to within 0.1 Da of theoretical.
If a CoA reports an observed mass that differs from theoretical by more than 1 Da on a modern instrument, something is either miscalibrated or the sample is not what the label says.
⚗️ Research Disclaimer: All content on this page is intended exclusively for licensed researchers, academic institutions, and scientific professionals operating within approved laboratory settings. The analytical methods discussed apply to research compounds not approved for human clinical use by the FDA or equivalent regulatory authorities. This content does not constitute medical advice, clinical guidance, or a recommendation for use in humans or animals outside of approved research protocols. For laboratory research use only.
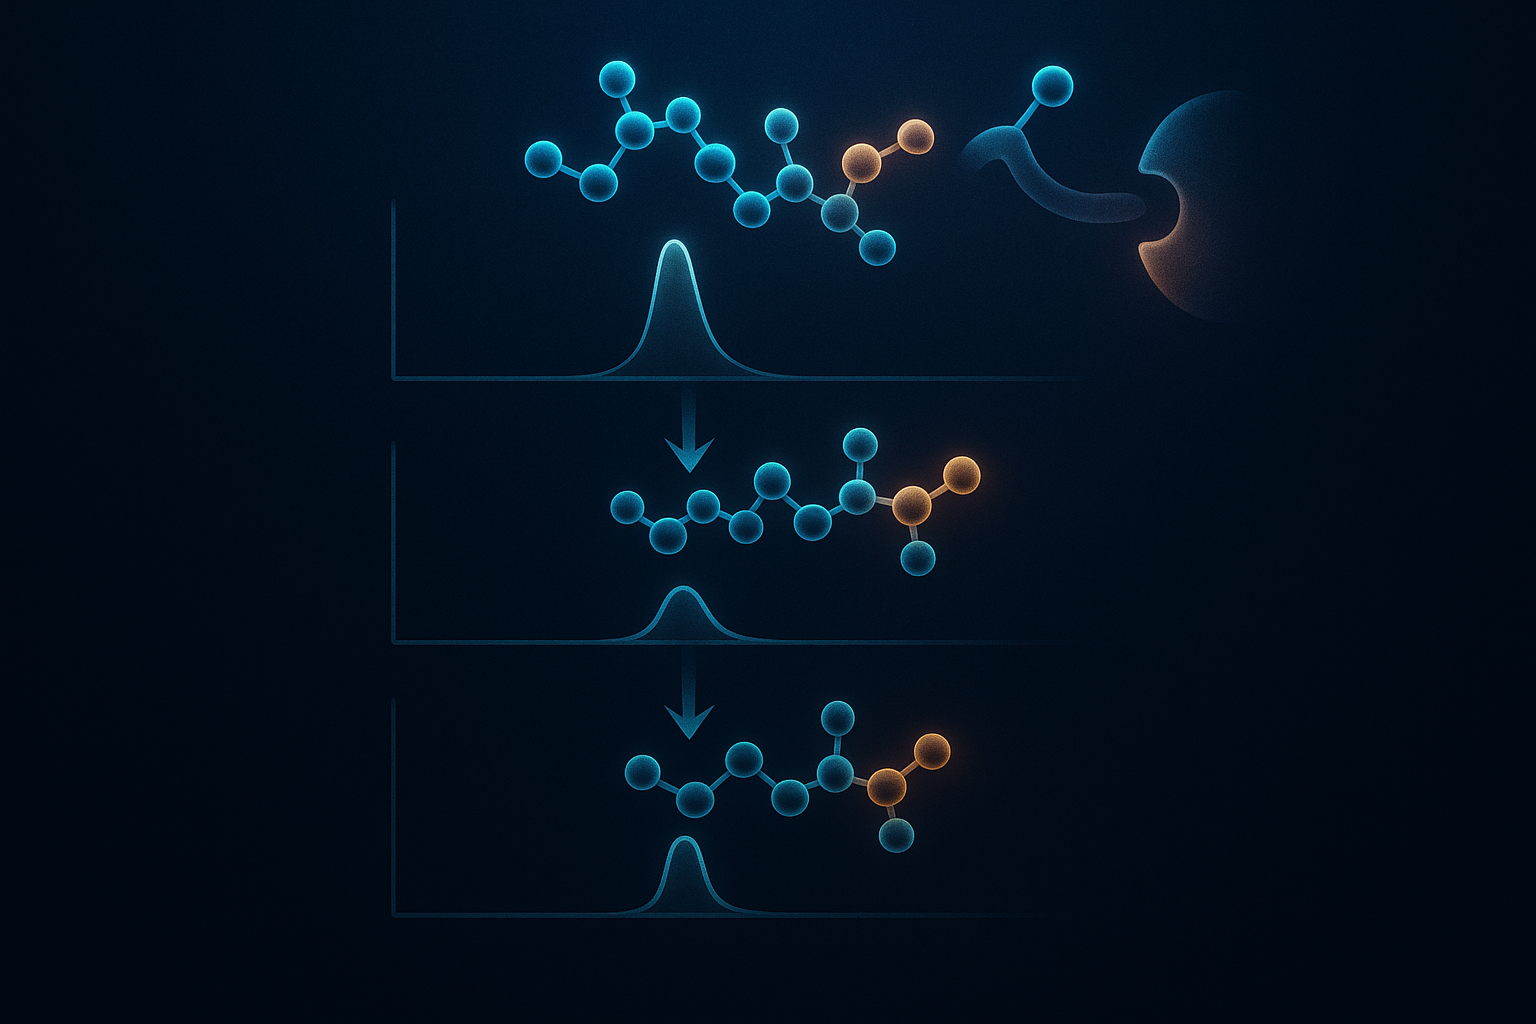
Mass spectrometry does more than confirm identity. It also fingerprints degradation. A compound that has partially degraded on the shelf will show characteristic mass shifts, and a researcher who knows the patterns can catch problems before they contaminate a research protocol.
The most common shelf-life problem for compounds is oxidation, and it shows up as a +16 Da peak next to the main molecular ion (one extra oxygen atom). Methionine and tryptophan residues are the usual targets. Chowdhury and colleagues characterized this pattern in detail for compound and protein pharmaceuticals in the mid-1990s and it has been the standard oxidation marker ever since (Chowdhury et al., 1995, PMID: 7549895).
A small +16 peak is often present even in a fresh sample; a large one suggests the sample has aged badly.
Asparagine and glutamine residues can spontaneously convert to aspartate and glutamate, respectively. a hydrolysis reaction that adds a single Dalton. Robinson and Robinson mapped the kinetics of this process across a wide range of compounds and showed that certain sequence contexts (N-G, N-S) deamidate within days at room temperature (Robinson & Robinson, 2001, PMID: 11337506). A +1 peak next to the main ion is a shelf-life warning.
Peaks at exactly half the compound mass usually indicate a dimer that dissociated during ionization, or a defined fragmentation product. Peaks at masses that do not correspond to any predictable cleavage of the sequence are worse. they suggest a contaminant.
Loss of a water molecule (-18 Da) can occur at serine or threonine residues, particularly under acidic storage conditions. It is less common than oxidation but shows up in old samples.
A frequent confusion: if mass spectrometry is so precise, why does a CoA also need an HPLC chromatogram? The two techniques answer different questions.
| Question | HPLC answers | MS answers |
|---|---|---|
| Is the molecule I ordered in this vial? | Weakly (retention time is a fingerprint) | Strongly (mass = identity) |
| How much of the sample is the target compound? | Strongly (peak area = purity %) | Weakly (ionization efficiency varies) |
| Are there impurities co-eluting with the target? | No (they hide under the same peak) | Yes (different molecules have different masses) |
The two techniques are complementary. HPLC integrates a UV signal to give a purity percentage; MS confirms that the peak at that retention time is the right molecule. A CoA that shows both is doing the job. A CoA that shows only HPLC leaves the identity question open. A CoA that shows only MS leaves the purity question open.
This is why every Vitro Labs lot ships with both. HPLC-UV for purity and net content, LC-MS for identity. verified independently by Freedom Diagnostics, an ISO-certified analytical laboratory. These are analytical-grade biochemical reference standards intended for in-vitro research, analytical method development, identity verification, and laboratory evaluation; the paired chromatogram and spectrum are what make that framing meaningful. For laboratory research use only.
The monoisotopic mass is calculated using only the most abundant isotope of each element (12C, 1H, 14N, 16O, 32S). The average mass uses the natural isotopic mixture of each element. For small compounds, high-resolution instruments (TOF, Orbitrap) resolve individual isotope peaks, so the monoisotopic mass is the relevant comparison. For larger compounds on low-resolution instruments, the isotope envelope blurs together and the average mass is what the instrument effectively measures. A well-formed CoA reports both.
ESI produces multiply-charged ions. A compound with a mass of 4800 Da might show peaks at m/z 4801 (singly charged), 2401 (doubly charged), 1601 (triply charged), and so on. The raw m/z values are not supposed to match the compound mass directly; they need to be deconvoluted. The deconvoluted mass, which is what the CoA reports as observed mass, is what should match the theoretical value. If a report only shows the raw spectrum without the deconvoluted number, ask the vendor for it.
It depends on the instrument. Quadrupole analyzers are accurate to about 0.5–1.0 Da, TOF instruments to about 0.05–0.2 Da, and Orbitrap or FT-ICR instruments to about 0.01–0.05 Da. On a modern research-grade CoA using TOF or Orbitrap detection, an observed mass that differs from theoretical by more than 1 Da is a red flag. A difference of a few tenths of a Dalton on a quadrupole may be within normal tolerance.
Sometimes, but not always. Substituting one amino acid for another usually changes the compound mass, and the MS report will catch the mismatch. However, isobaric substitutions. leucine for isoleucine, for example, both of which have identical mass. cannot be distinguished by mass alone. Distinguishing them requires tandem MS (MS/MS) with fragmentation, which is not usually part of a standard identity CoA. For most research applications, the intact mass measurement is sufficient because non-isobaric errors are far more common than isobaric ones.
A single oxidation event. One oxygen atom (mass 16) has been added to the compound, most commonly at a methionine or tryptophan residue. A small +16 peak is often present even in fresh material, but a large one. or a series of +16, +32, +48 peaks indicating multiple oxidation events. suggests the sample has degraded in storage. Chowdhury and colleagues (1995) characterized these signatures in detail for compound and protein pharmaceuticals (PMID: 7549895). Storage under inert atmosphere and cold conditions slows oxidation substantially.
No. Mass spectrometry measures molecular identity and detects modifications and degradation products of the compound itself. Endotoxin testing is a separate assay (usually LAL. Limulus amebocyte lysate). Sterility testing is a microbiological method. Heavy-metal analysis uses ICP-MS or atomic absorption spectrometry. These are all distinct methods, and a CoA that reports mass spectrometry results does not automatically imply that any of the other assays were performed. Vitro Labs certificates report identity by LC-MS, purity by HPLC-UV, net content, and appearance. nothing else.
⚗️ Research Disclaimer: All content on this page is intended exclusively for licensed researchers, academic institutions, and scientific professionals operating within approved laboratory settings. The analytical methods discussed apply to research compounds not approved for human clinical use by the FDA or equivalent regulatory authorities. This content does not constitute medical advice, clinical guidance, or a recommendation for use in humans or animals outside of approved research protocols. For laboratory research use only.